INVESTOR RELATIONS
SEGMENT RESULTS
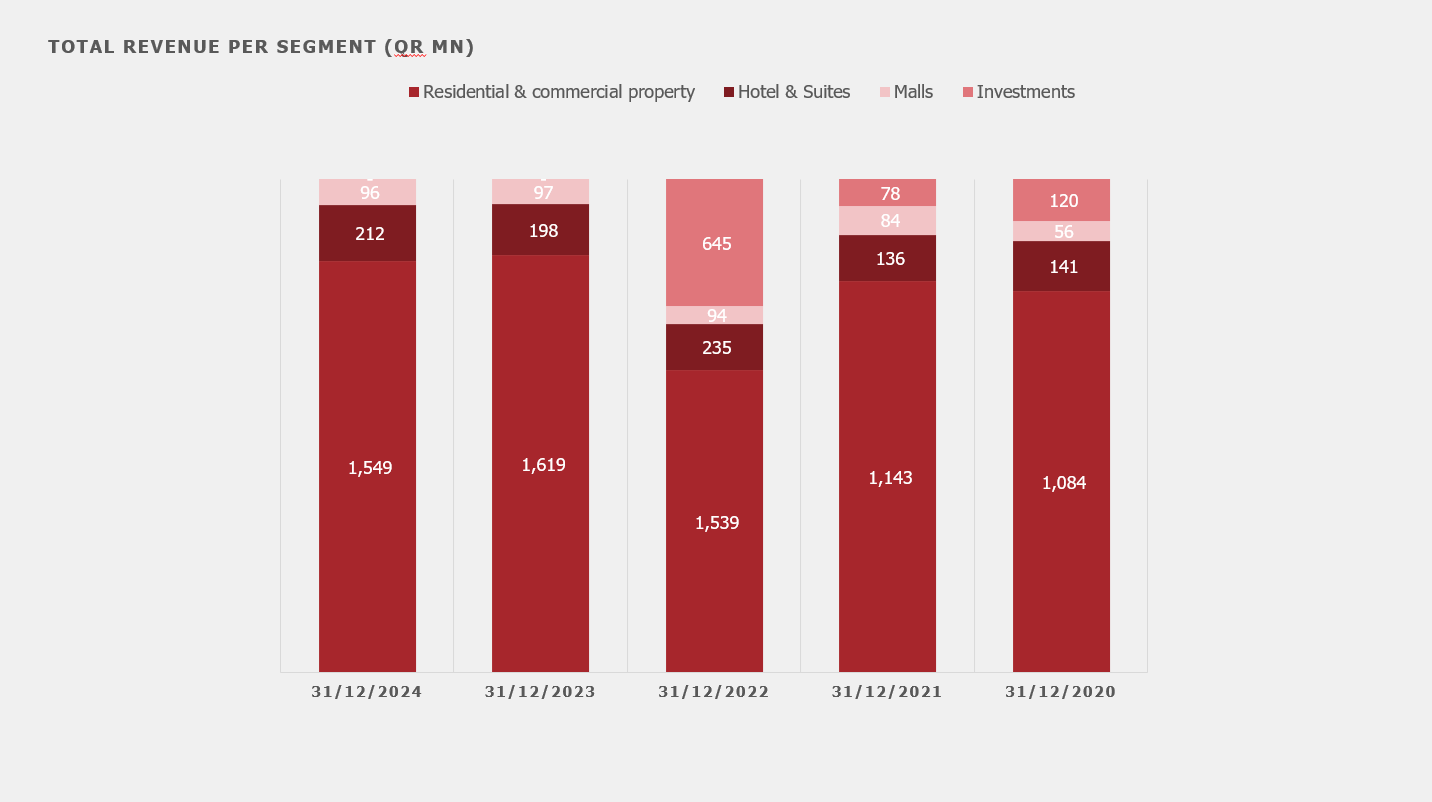
The Group is divided into Four operating segments.
- 1- Residential & Commercial Property: The
segment includes developing, owning, trading and renting of real estates.
- 2- Hotel & Suites: The segment includes managing
hotels, suites, and restaurants.
- 3- Investments: The segment is engaged in investing
activities like shares
- 4- Malls sector: The segment is includes management
of commercial centers.
| |
|
|
|
|
|
| Total Revenue |
|
|
|
|
|
| Residential & commercial property |
427 |
1,539 |
1,137 |
1,084 |
1,136 |
| Hotel & Suites |
44 |
235 |
142 |
141 |
208 |
| Malls |
24 |
94 |
84 |
56 |
86 |
| Investments |
- |
645 |
78 |
120 |
239 |
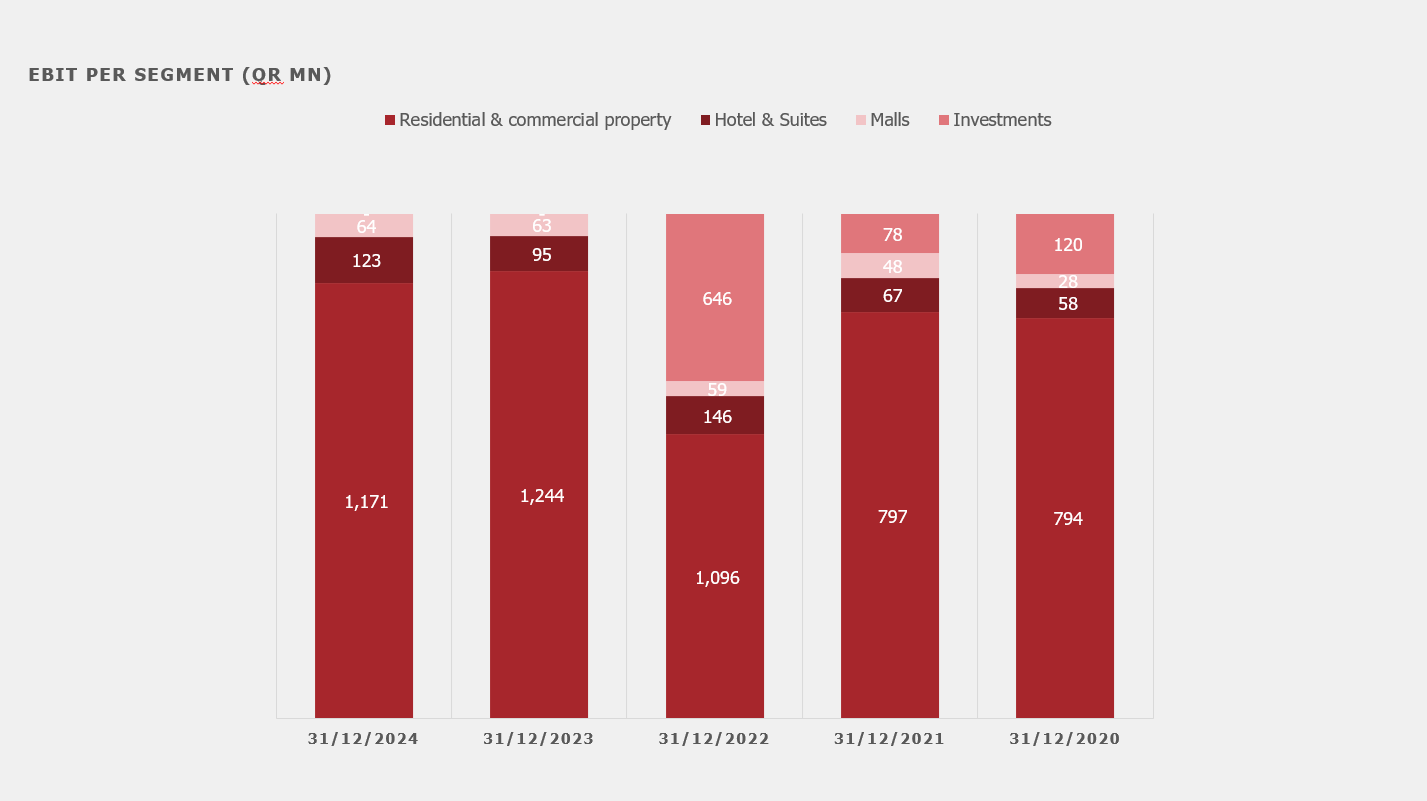
| EBIT |
|
|
|
|
|
| Residential & commercial property |
313 |
1,099 |
795 |
794 |
798 |
| Hotel & Suites |
25 |
143 |
69 |
58 |
127 |
| Malls |
12 |
58 |
48 |
25 |
53 |
| Investments |
- |
646 |
78 |
120 |
239 |
| Segment Revenue Contribution
|
|
|
|
|
|
| Residential & commercial property |
86.19% |
61.24% |
78.88% |
77.38% |
68.05% |
| Hotel & Suites |
8.91% |
9.35% |
9.87% |
10.09% |
12.47% |
| Malls |
4.91% |
3.74% |
5.85% |
3.96% |
5.18% |
| Investments |
0.00% |
25.66% |
5.40% |
8.57% |
14.30% |
| Segment EBIT Contribution
|
|
|
|
|
|
| Residential & commercial property |
89.31% |
56.48% |
80.32% |
79.40% |
65.55% |
| Hotel & Suites |
7.27% |
7.36% |
7.01% |
5.79% |
10.46% |
| Malls |
3.42% |
2.99% |
4.84% |
2.83% |
4.39% |
| Investments |
0.00% |
33.17% |
7.84% |
11.98% |
19.60% |
| |
|
|
|
|
|
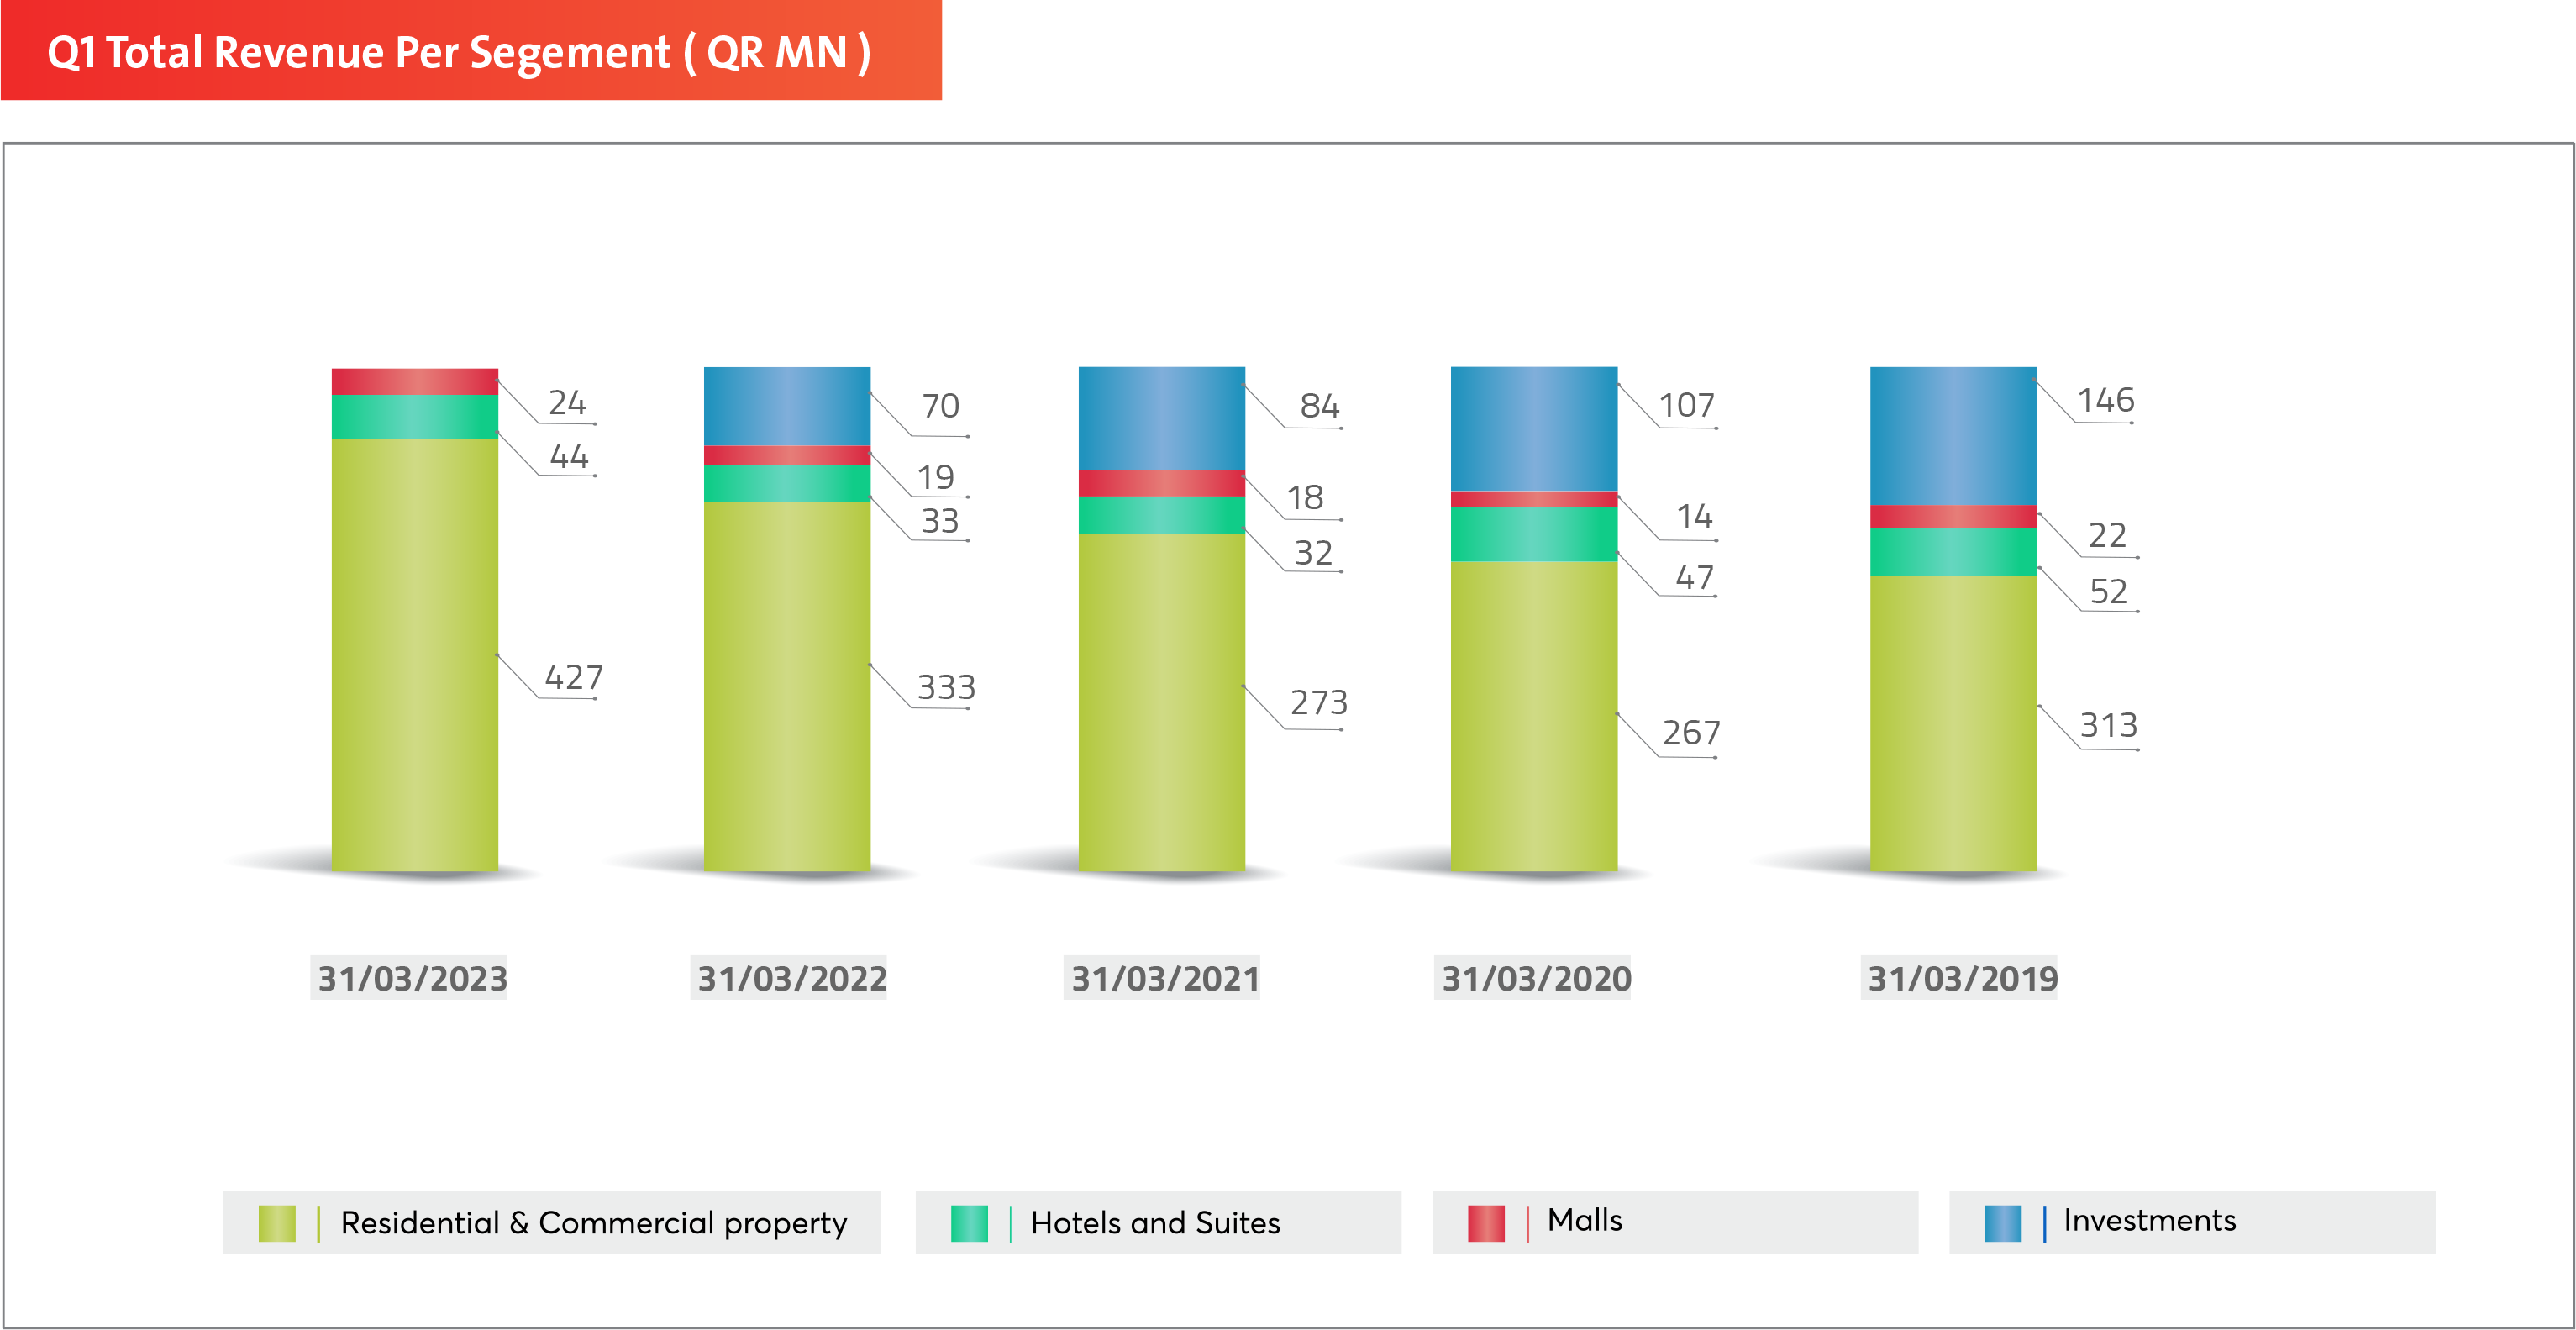
| Total Revenue |
|
|
|
|
|
|
| Residential & commercial property |
427 |
333 |
271 |
265 |
313 |
| Hotel & Suites |
44 |
33 |
33 |
49 |
52 |
| Malls |
24 |
19 |
18 |
14 |
22 |
| Investments |
- |
70 |
84 |
107 |
146 |
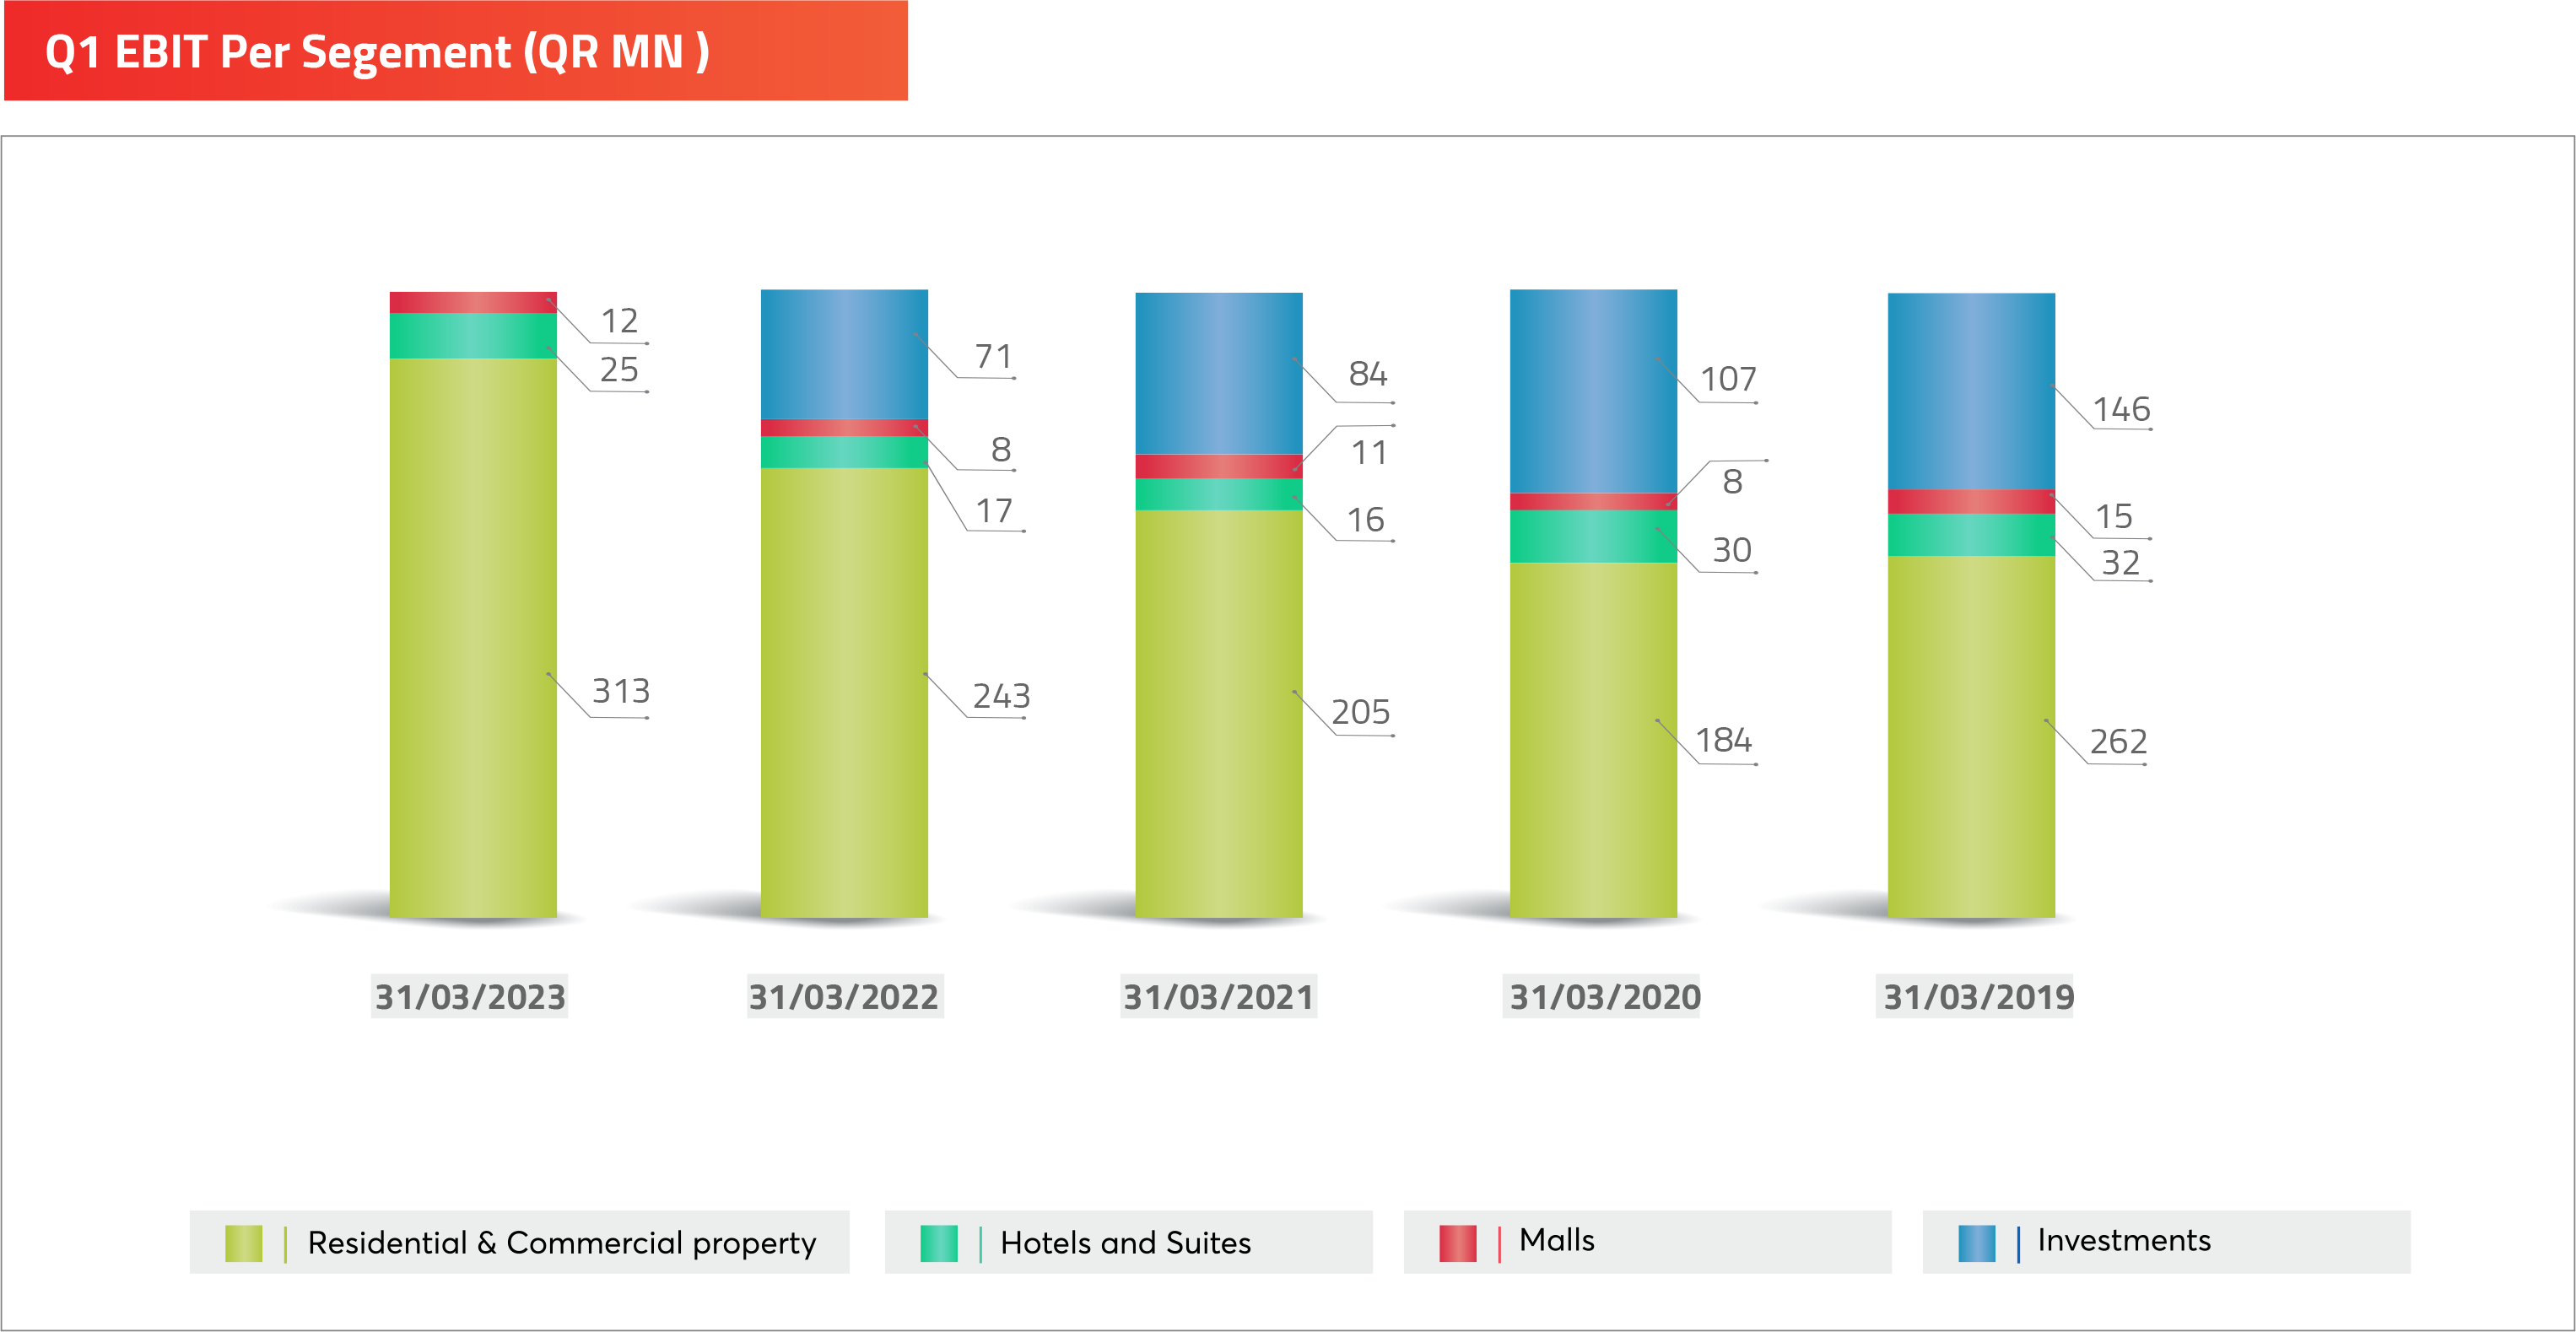
| EBIT |
|
|
|
|
|
|
| Residential & commercial property |
313 |
243 |
205 |
184 |
262 |
| Hotel & Suites |
25 |
17 |
16 |
30 |
32 |
| Malls |
12 |
8 |
11 |
8 |
15 |
| Investments |
- |
71 |
84 |
107 |
146 |
| Segment Revenue Contribution
|
|
|
|
|
|
|
| Residential & commercial property |
86.19% |
73.18% |
66.71% |
61.37% |
58.64% |
| Hotel & Suites |
8.91% |
7.30% |
8.16% |
10.83% |
9.83% |
| Malls |
4.91% |
4.17% |
4.51% |
3.26% |
4.10% |
| Investments |
0.00% |
15.36% |
20.62% |
24.54% |
27.44% |
| Segment EBIT Contribution
|
|
|
|
|
|
|
| Residential & commercial property |
89.31% |
71.87% |
64.91% |
55.97% |
57.58% |
| Hotel & Suites |
7.27% |
4.94% |
5.07% |
9.19% |
7.03% |
| Malls |
3.42% |
2.34% |
3.52% |
2.33% |
3.30% |
| Investments |
0.00% |
20.86% |
26.50% |
32.51% |
32.10% |
| |
|
|
|
|
|
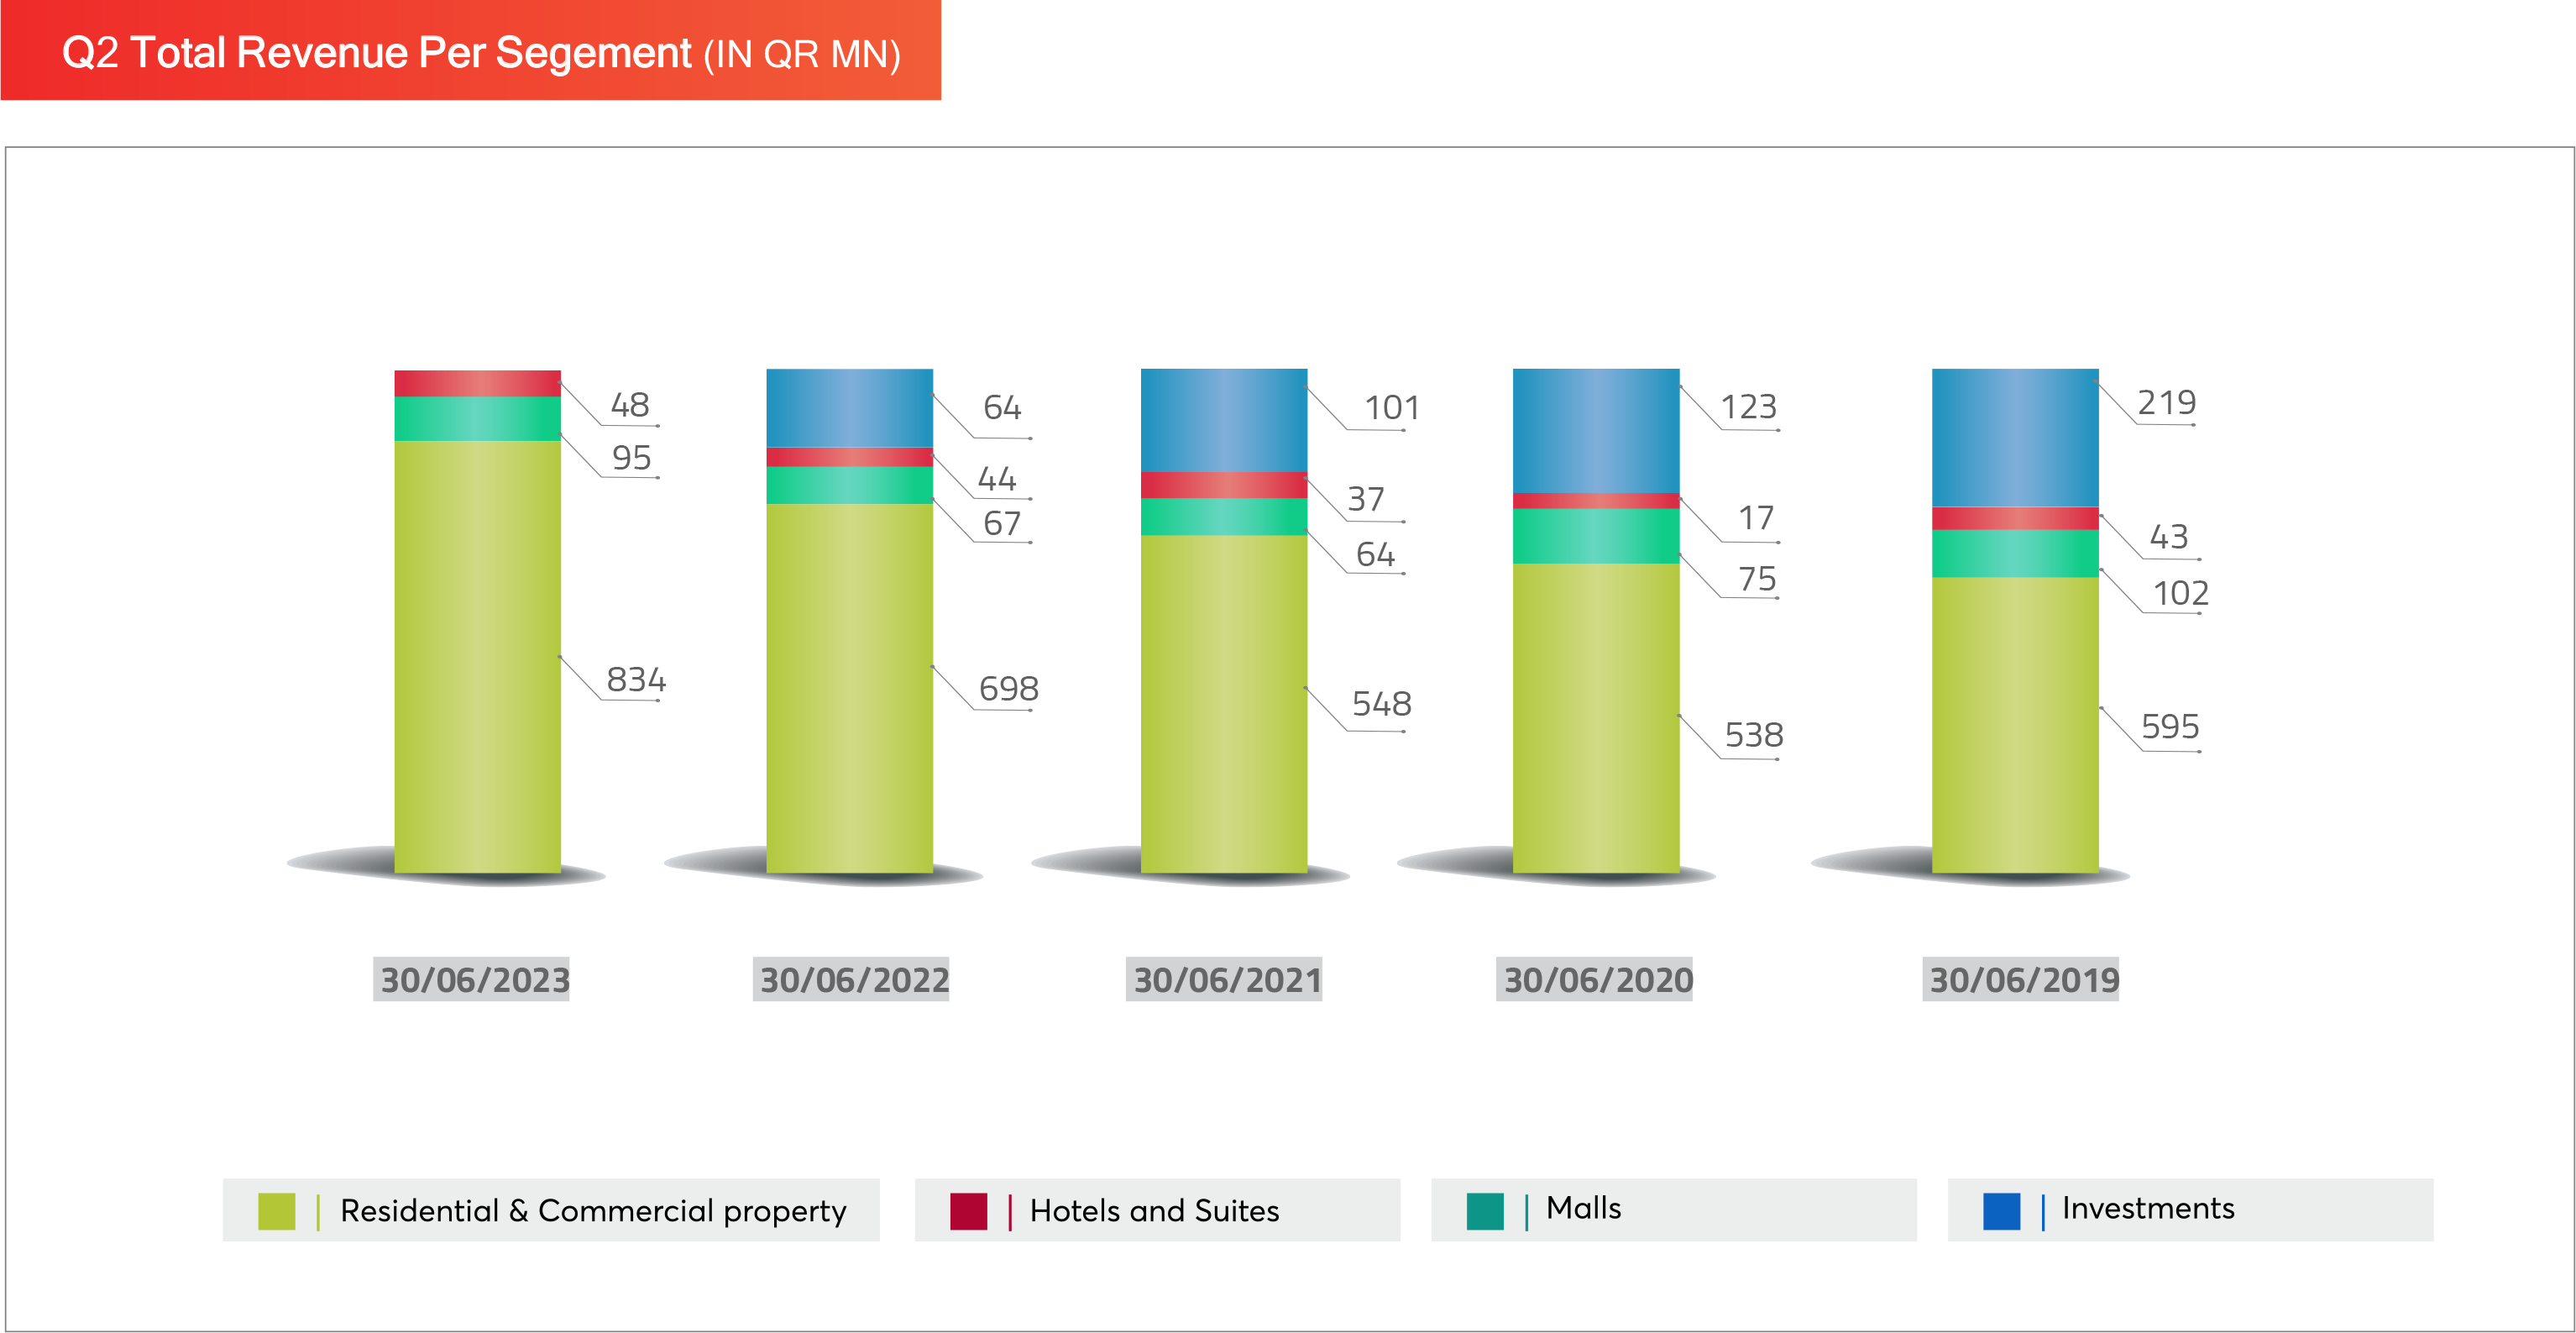
| Total Revenue |
|
|
|
|
|
| Residential & commercial property |
834 |
698 |
548 |
538 |
594 |
| Hotel & Suites |
95 |
67 |
64 |
75 |
102 |
| Malls |
48 |
44 |
37 |
17 |
44 |
| Investments |
- |
64 |
101 |
123 |
219 |
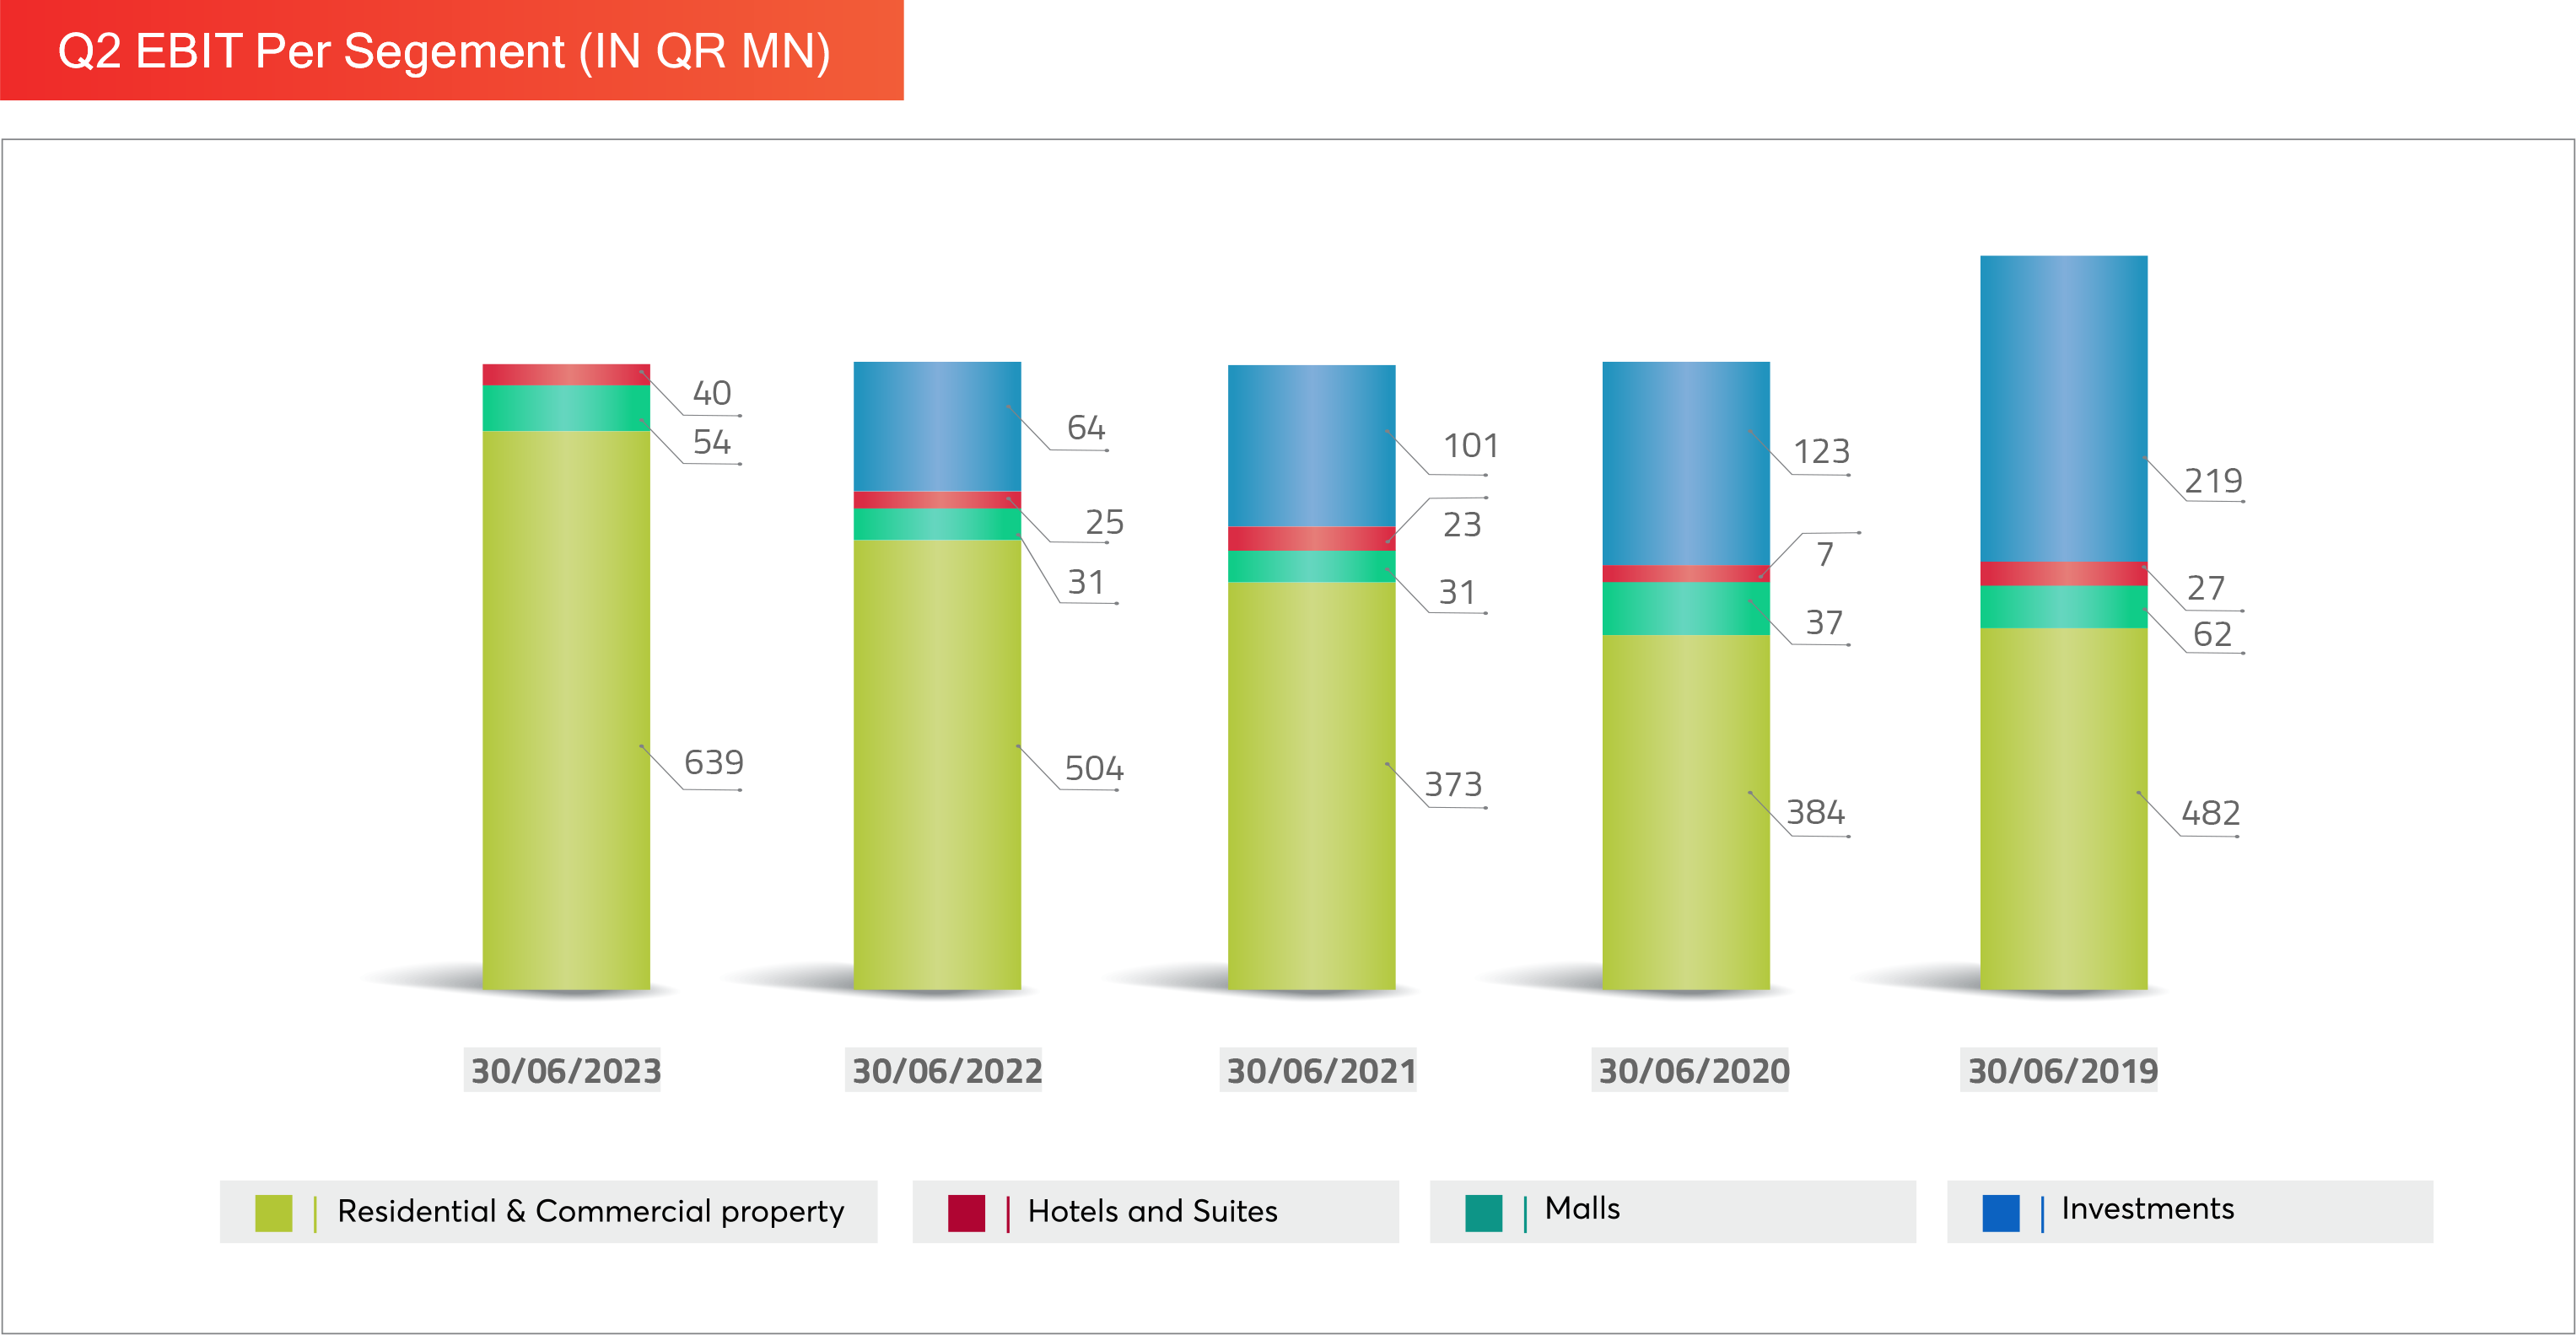
| EBIT |
|
|
|
|
|
| Residential & commercial property |
639 |
504 |
372 |
383 |
481 |
| Hotel & Suites |
54 |
31 |
32 |
38 |
62 |
| Malls |
40 |
25 |
23 |
7 |
28 |
| Investments |
- |
64 |
101 |
123 |
219 |
| Segment Revenue Contribution
|
|
|
|
|
|
| Residential & commercial property |
85.34% |
80.06% |
72.98% |
71.43% |
61.93% |
| Hotel & Suites |
9.74% |
7.64% |
8.55% |
9.98% |
10.67% |
| Malls |
4.92% |
5.00% |
4.98% |
2.32% |
4.55% |
| Investments |
0.00% |
7.30% |
13.49% |
16.28% |
22.85% |
| Segment EBIT Contribution
|
|
|
|
|
|
| Residential & commercial property |
87.19% |
80.65% |
70.34% |
69.55% |
60.87% |
| Hotel & Suites |
7.41% |
4.99% |
6.10% |
6.86% |
7.89% |
| Malls |
5.40% |
4.07% |
4.40% |
1.34% |
3.51% |
| Investments |
0.00% |
10.29% |
19.15% |
22.24% |
27.73% |
| |
|
|
|
|
|
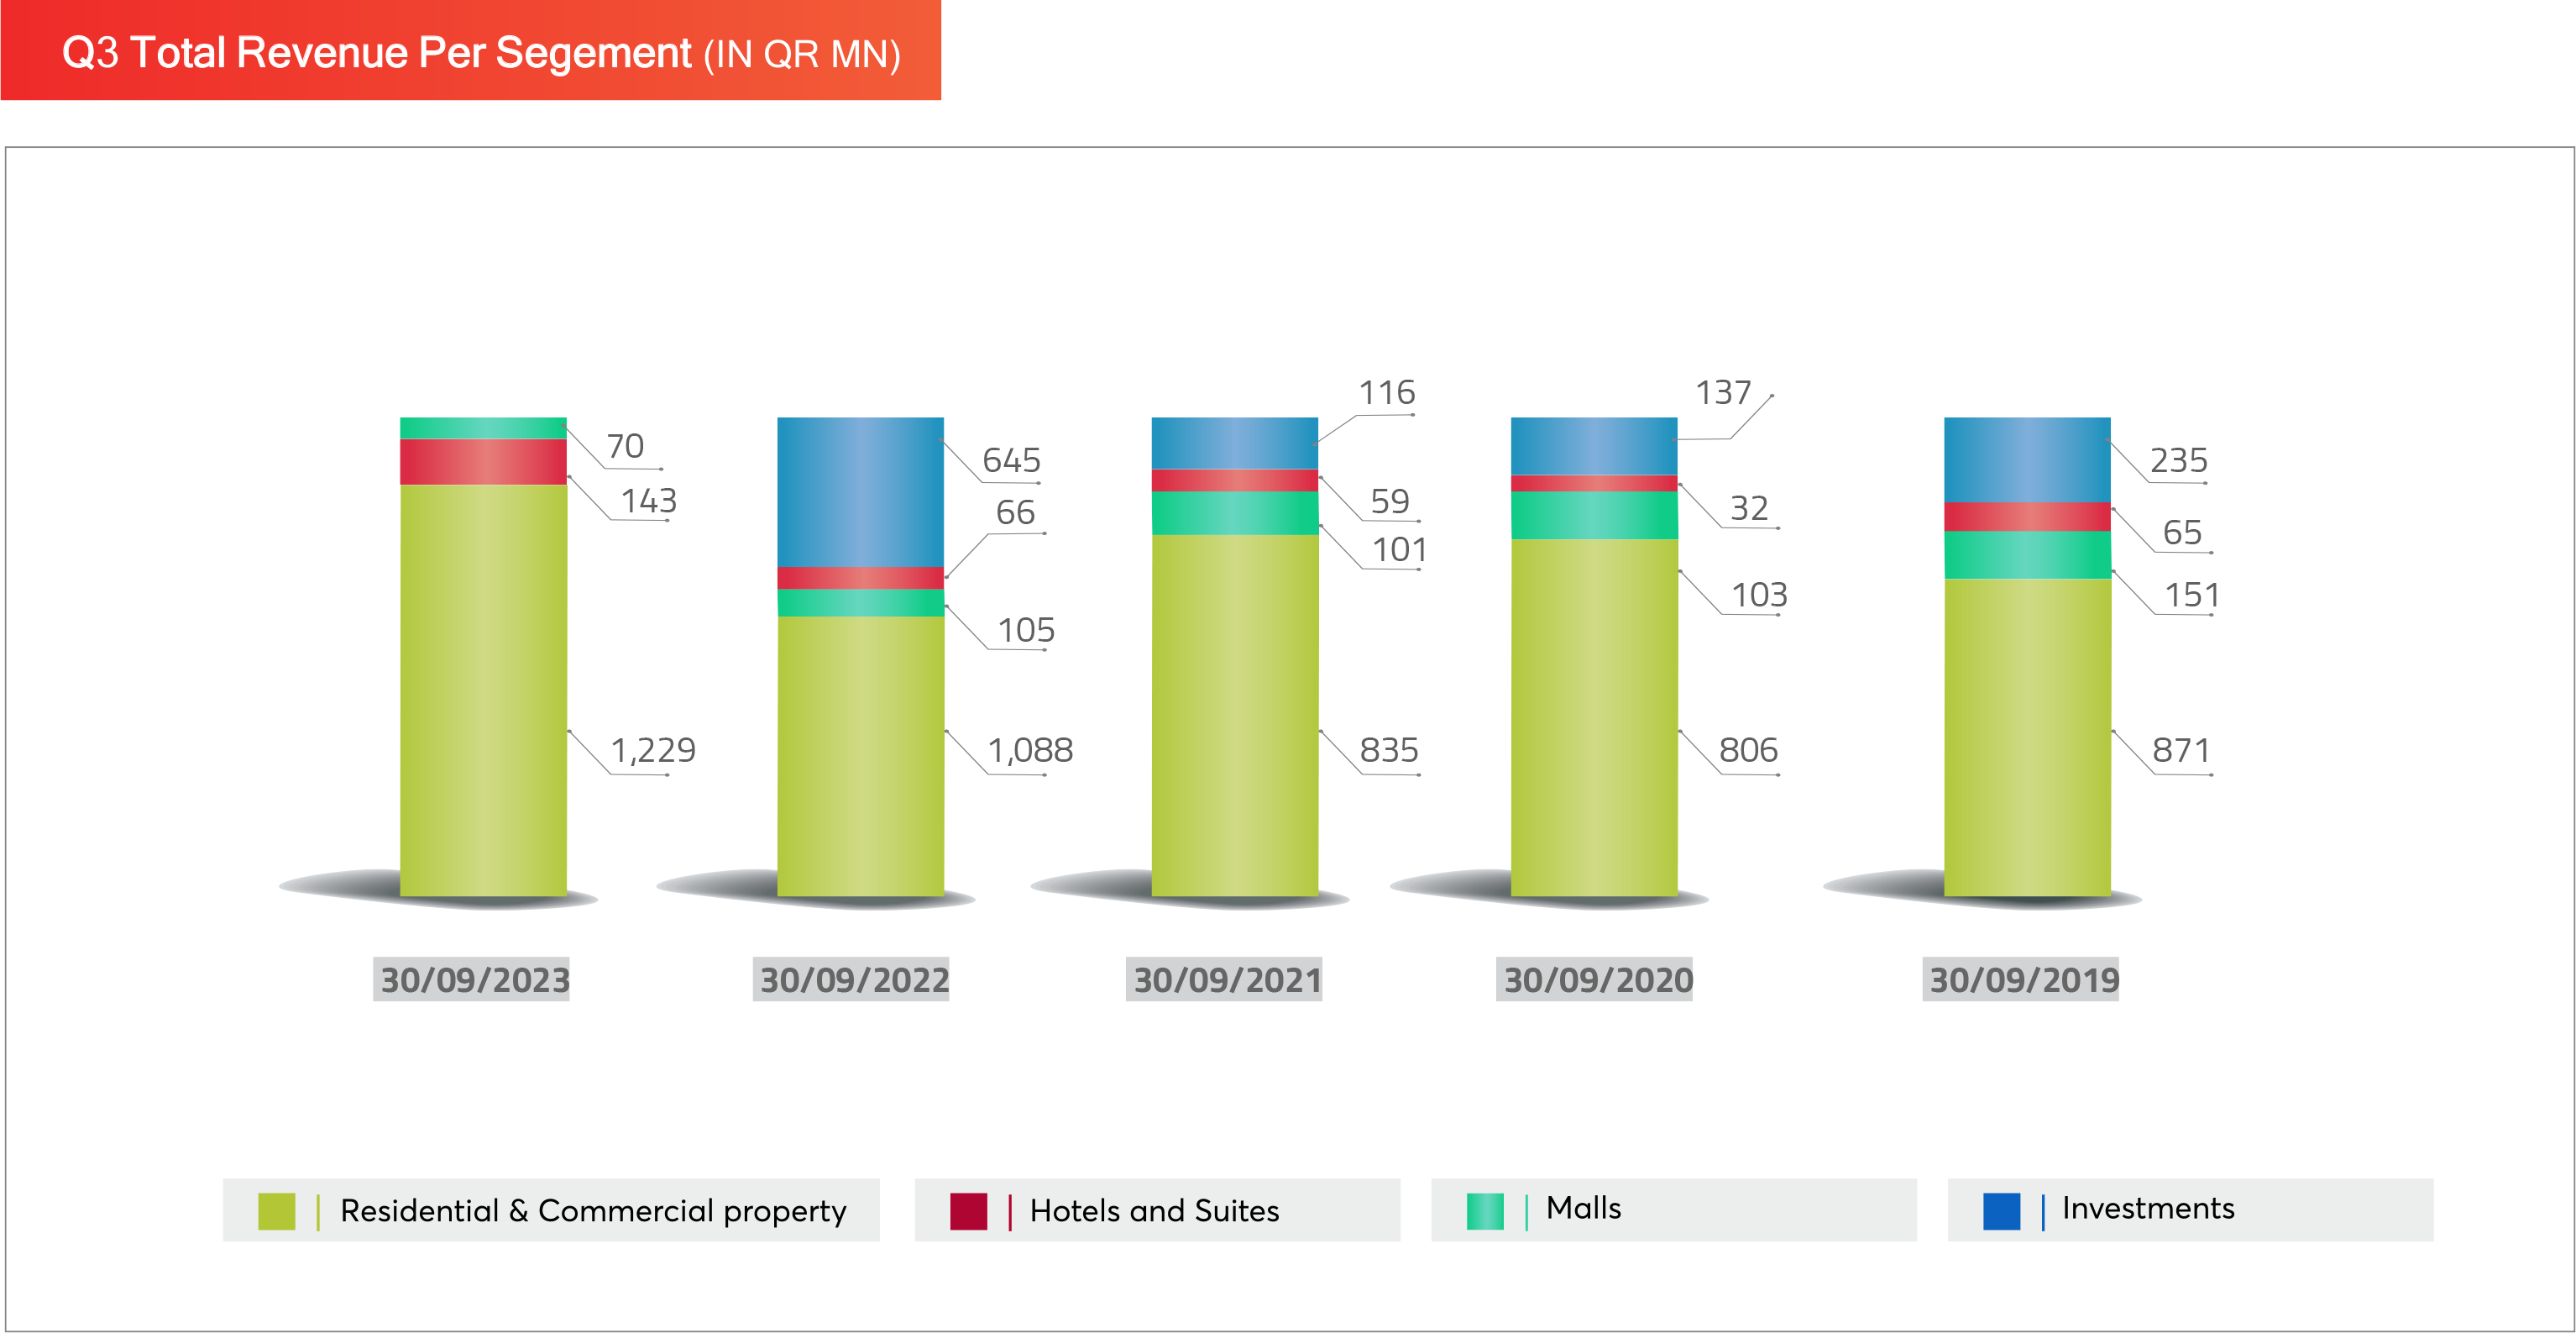
| Total Revenue |
|
|
|
|
|
|
| Residential & commercial property |
1,229 |
1,088 |
835 |
806 |
871 |
| Hotel & Suites |
143 |
105 |
101 |
103 |
151 |
| Malls |
70 |
66 |
59 |
32 |
65 |
| Investments |
- |
645 |
116 |
137 |
235 |
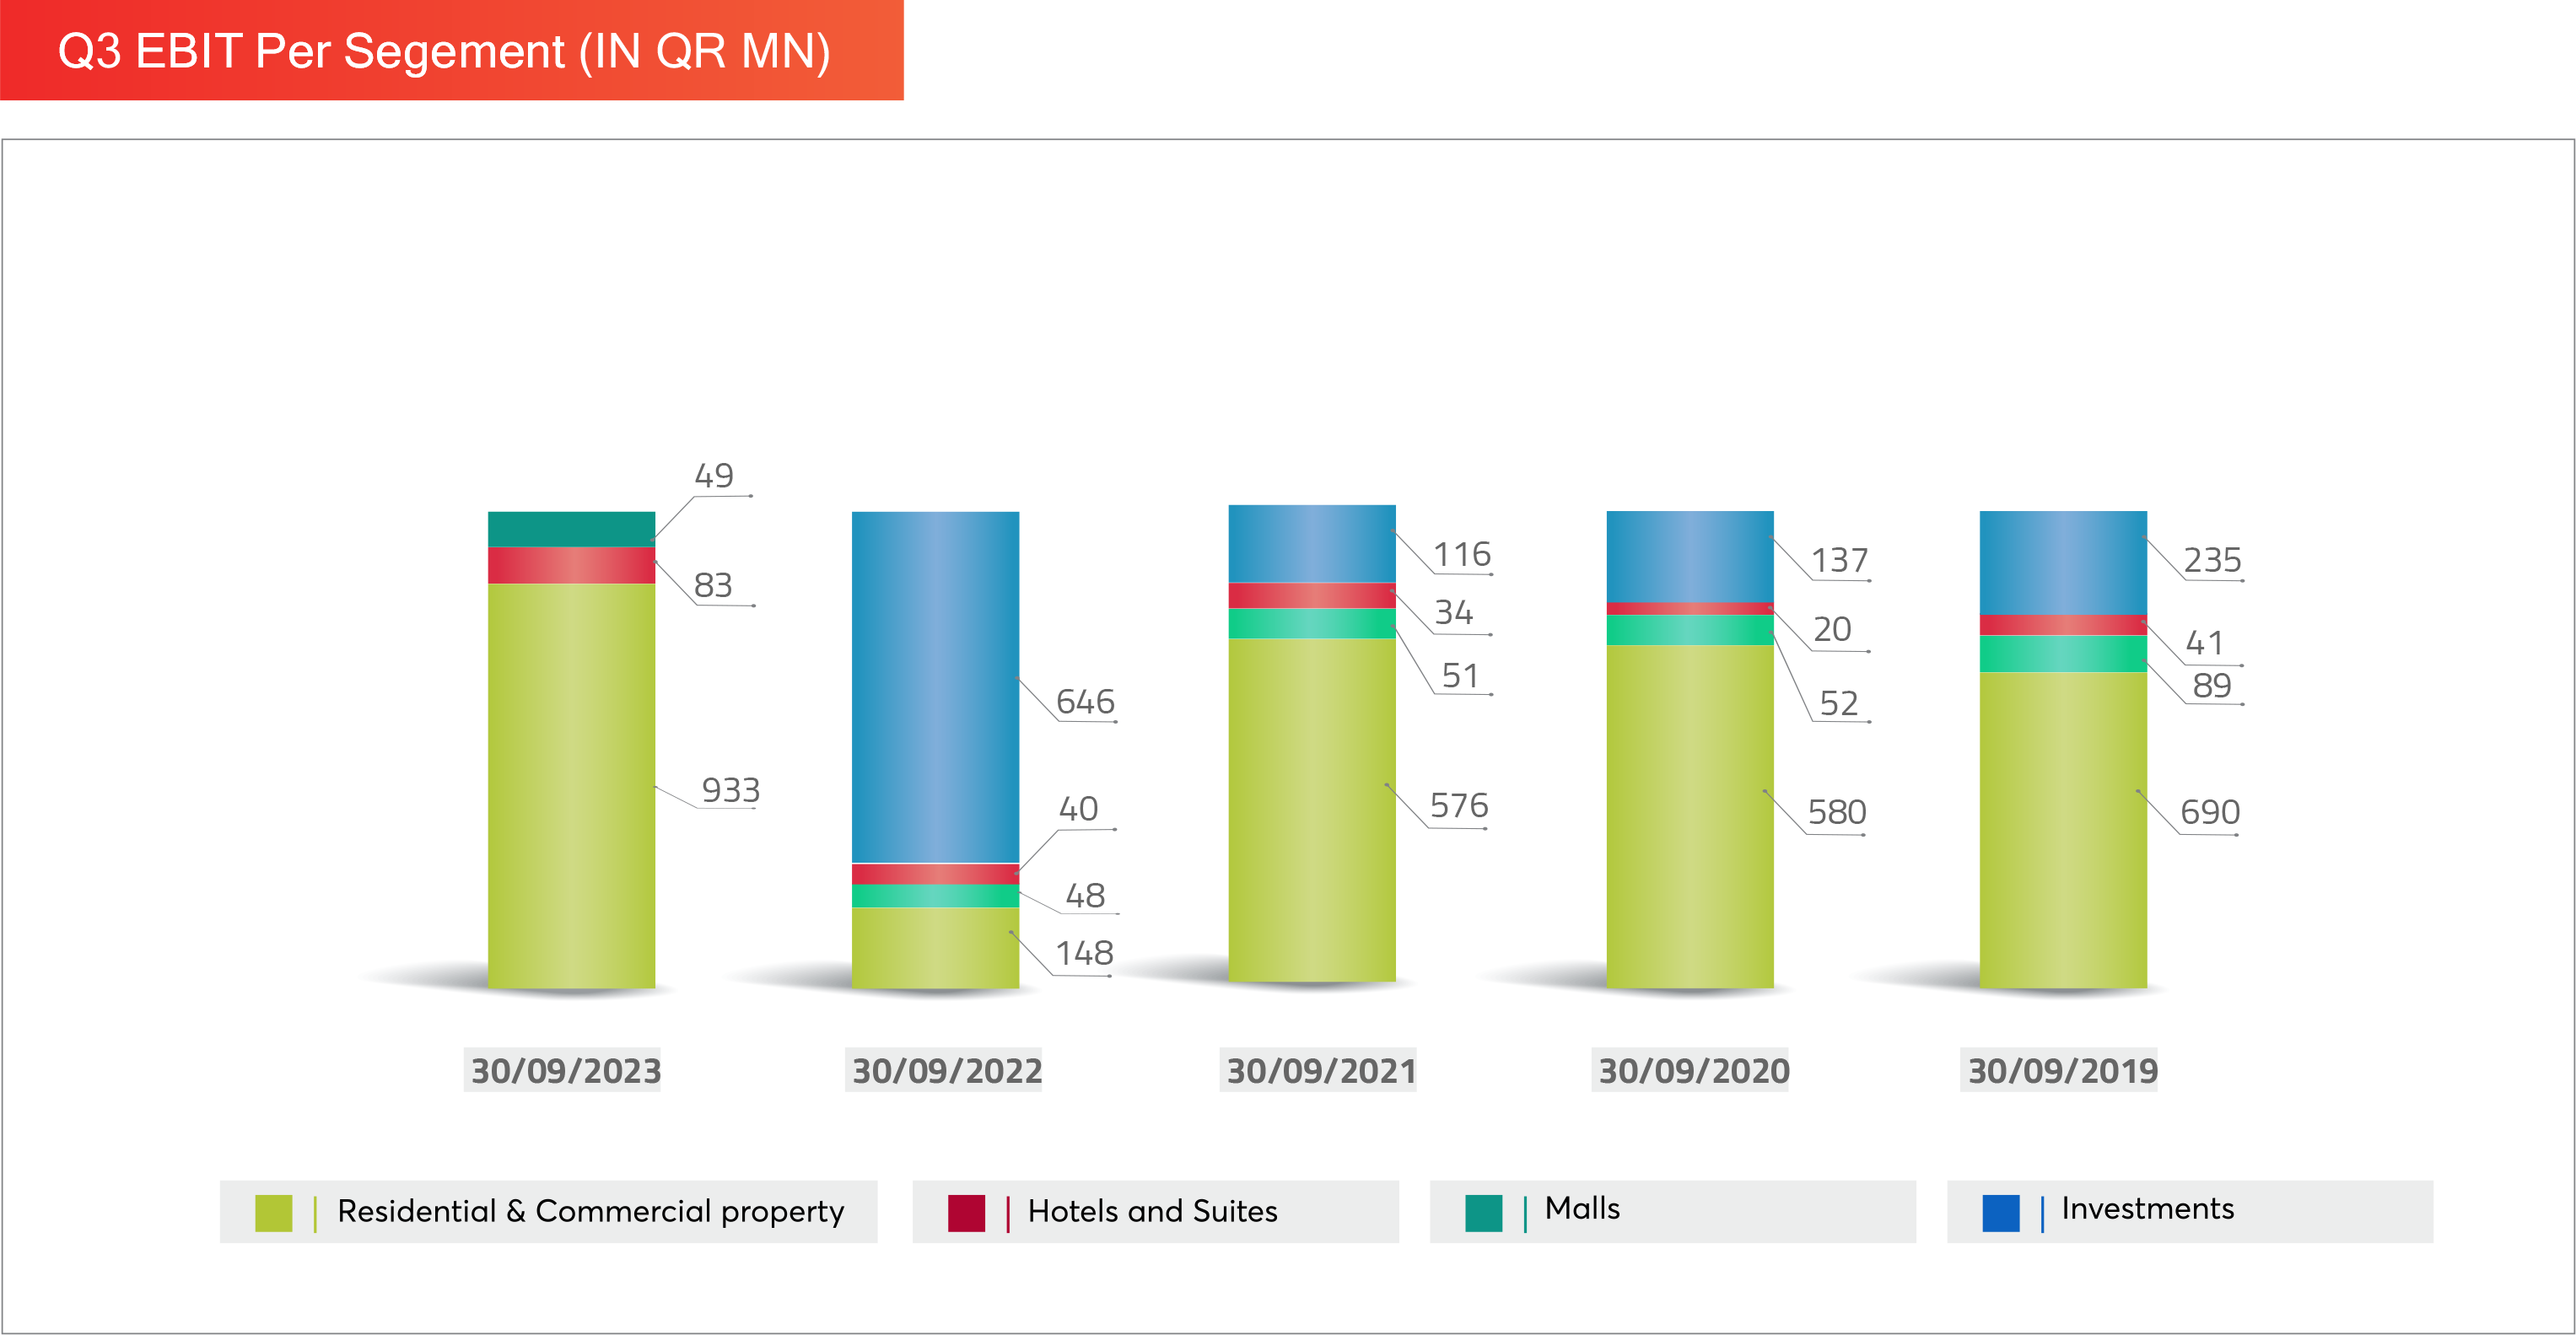
| EBIT |
|
|
|
|
|
| Residential & commercial property |
933 |
148 |
576 |
579 |
690 |
| Hotel & Suites |
83 |
48 |
51 |
53 |
89 |
| Malls |
49 |
40 |
34 |
20 |
41 |
| Investments |
- |
646 |
116 |
137 |
235 |
| Segment Revenue Contribution
|
|
|
|
|
|
|
| Residential & commercial property |
85.24% |
57.12% |
75.18% |
74.76% |
65.89% |
| Hotel & Suites |
9.92% |
5.52% |
9.12% |
9.52% |
11.43% |
| Malls |
4.84% |
3.49% |
5.29% |
3.01% |
4.92% |
| Investments |
0.00% |
33.87% |
10.41% |
12.71% |
17.76% |
| Segment EBIT Contribution
|
|
|
|
|
|
|
| Residential & commercial property |
87.60% |
16.84% |
74.21% |
73.38% |
65.42% |
| Hotel & Suites |
7.76% |
5.41% |
6.51% |
6.71% |
8.40% |
| Malls |
4.65% |
4.53% |
4.40% |
2.53% |
3.92% |
| Investments |
0.00% |
73.22% |
14.88% |
17.37% |
22.26% |