INVESTOR RELATIONS
SEGMENT RESULTS
The Group is divided into Four operating segments.
- 1- Residential & Commercial Property: The
segment includes developing, owning, trading and renting of real estates.
- 2- Hotel & Suites: The segment includes managing
hotels, suites, and restaurants.
- 3- Investments: The segment is engaged in investing
activities like shares
- 4- Malls sector: The segment is includes management
of commercial centers.
| |
|
|
|
|
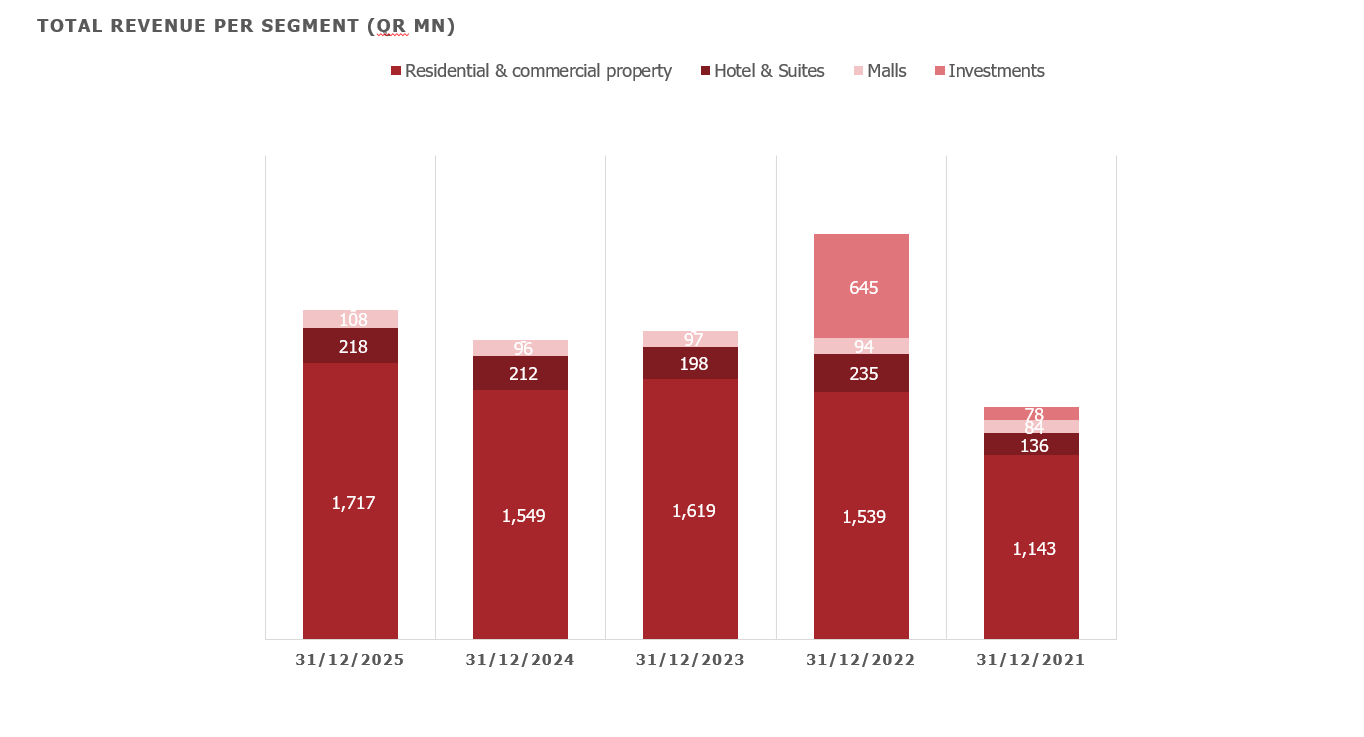
| Total Revenue |
|
|
|
|
| Residential & commercial property |
1,717 |
1,549 |
1,619 |
1,539 |
1,143 |
| Hotel & Suites |
218 |
212 |
198 |
235 |
136 |
| Malls |
108 |
96 |
97 |
94 |
84 |
| Investments |
- |
- |
- |
645 |
78 |
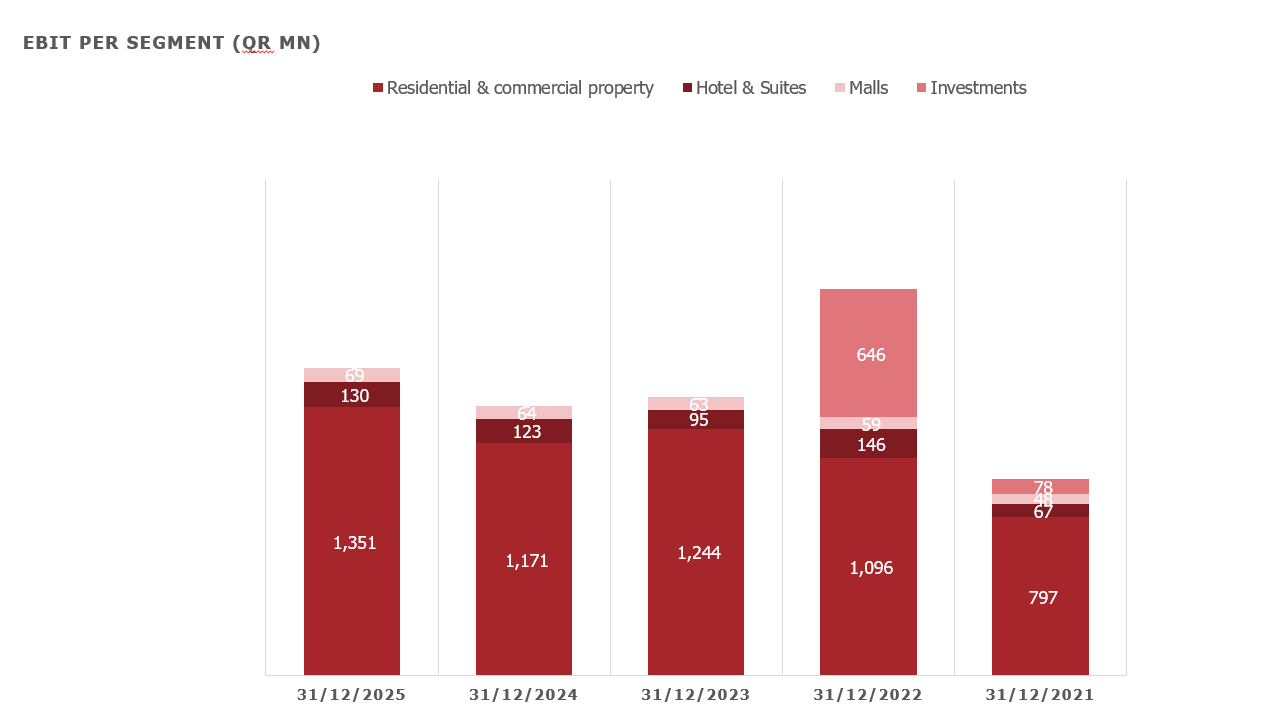
| EBIT (QR Mn) |
|
|
|
|
| Residential & commercial property |
1,351 |
1,171 |
1,244 |
1,096 |
797 |
| Hotel & Suites |
130 |
123 |
95 |
146 |
67 |
| Malls |
69 |
64 |
63 |
59 |
48 |
| Investments |
- |
- |
- |
646 |
78 |
| Segment Revenue Contribution (%)
|
|
|
|
|
| Residential & commercial property |
84.03% |
83.42% |
84.60% |
61.24% |
79.33% |
| Hotel & Suites |
10.69% |
11.43% |
10.32% |
9.35% |
9.42% |
| Malls |
5.28% |
5.15% |
5.08% |
3.74% |
5.85% |
| Investments |
0.00% |
0.00% |
0.00% |
25.66% |
5.40% |
| Segment EBIT Contribution |
|
|
|
|
| Residential & commercial property |
87.14% |
86.25% |
88.74% |
56.32% |
80.56% |
| Hotel & Suites |
8.40% |
9.08% |
6.78% |
7.49% |
6.77% |
| Malls |
4.46% |
4.68% |
4.48% |
3.02% |
4.84% |
| Investments |
0.00% |
0.00% |
0.00% |
33.17% |
7.84% |
| |
|
|
|
|
|
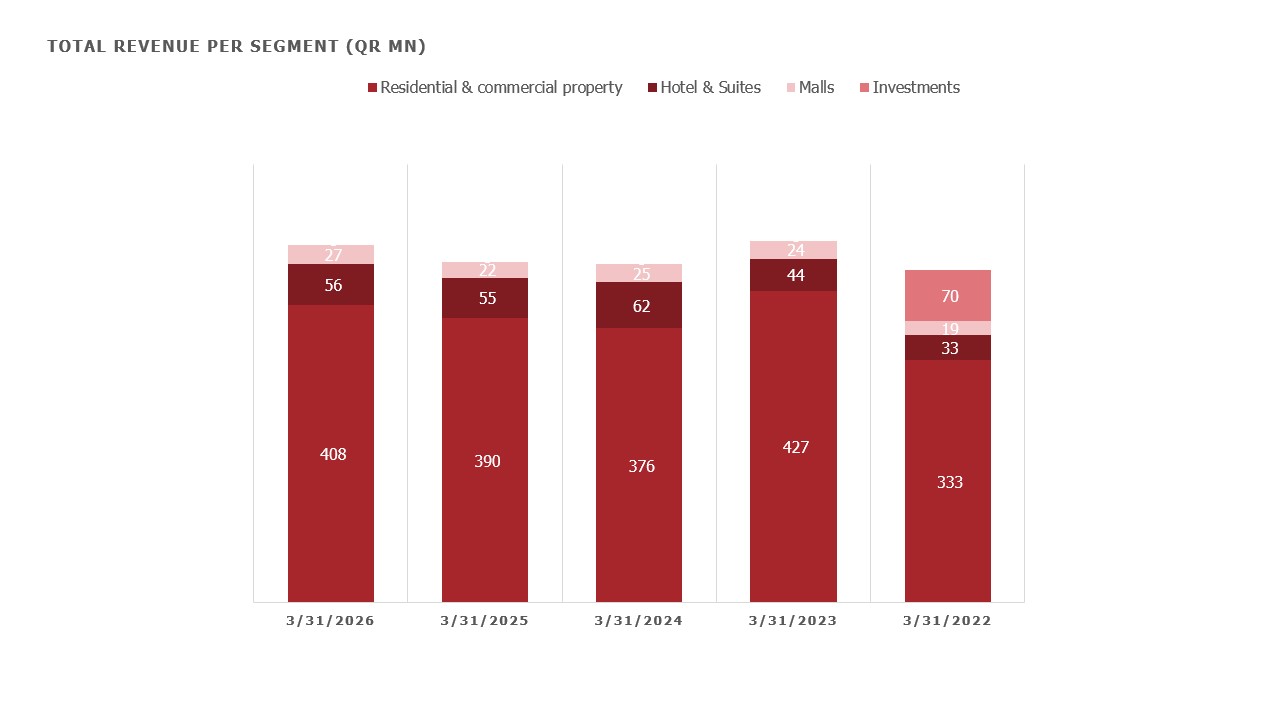
| Total Revenue |
|
|
|
|
|
|
| Residential & commercial property |
408 |
390 |
376 |
427 |
333 |
| Hotel & Suites |
56 |
55 |
62 |
44 |
33 |
| Malls |
27 |
22 |
25 |
24 |
19 |
| Investments |
- |
- |
- |
- |
70 |
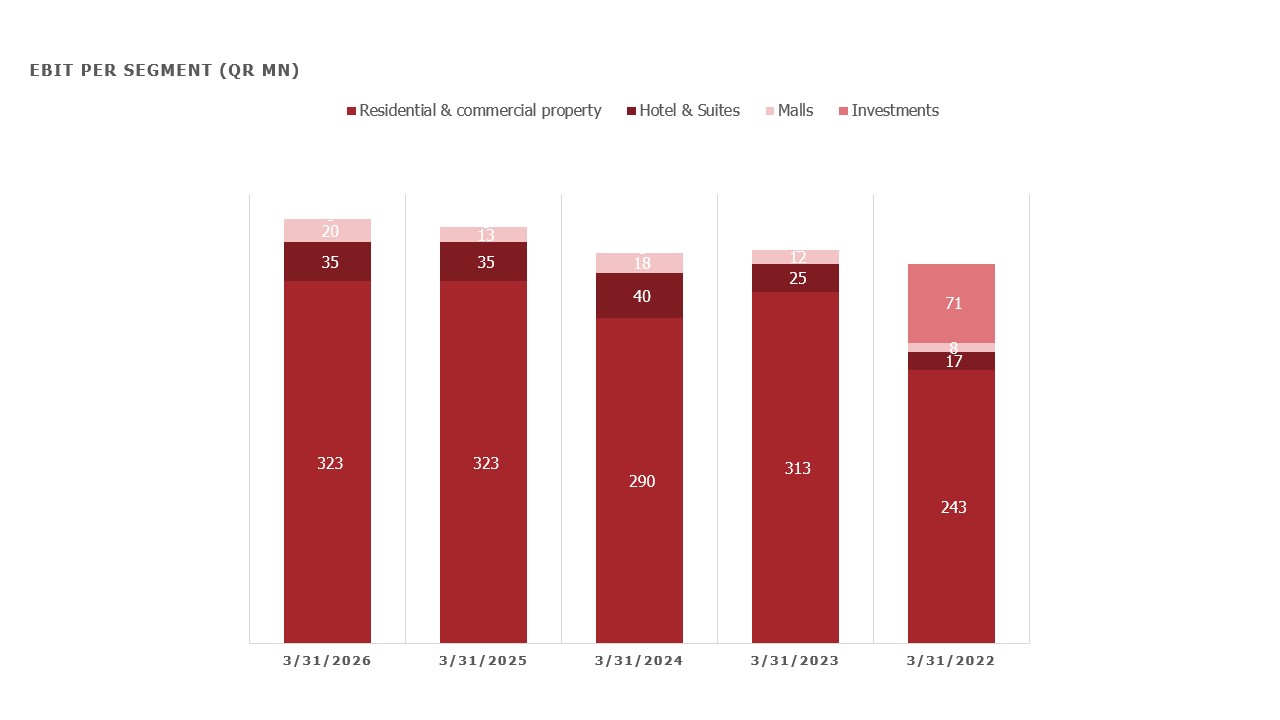
| EBIT |
|
|
|
|
|
|
| Residential & commercial property |
323 |
323 |
290 |
313 |
243 |
| Hotel & Suites |
35 |
35 |
40 |
25 |
17 |
| Malls |
20 |
13 |
18 |
12 |
8 |
| Investments |
- |
- |
- |
- |
71 |
| Segment Revenue Contribution
|
|
|
|
|
|
|
| Residential & commercial property |
83.20% |
83.61% |
81.11% |
86.19% |
73.18% |
| Hotel & Suites |
11.37% |
11.69% |
13.46% |
8.91% |
7.30% |
| Malls |
5.44% |
4.70% |
5.43% |
4.91% |
4.17% |
| Investments |
0.00% |
0.00% |
0.00% |
0.00% |
15.36% |
| Segment EBIT Contribution
|
|
|
|
|
|
|
| Residential & commercial property |
85.40% |
86.98% |
83.31% |
89.31% |
71.87% |
| Hotel & Suites |
9.30% |
9.52% |
11.48% |
7.27% |
4.94% |
| Malls |
5.30% |
3.50% |
5.20% |
3.42% |
2.34% |
| Investments |
0.00% |
0.00% |
0.00% |
0.00% |
20.86% |
| |
|
|
|
|
|
| |
|
|
|
|
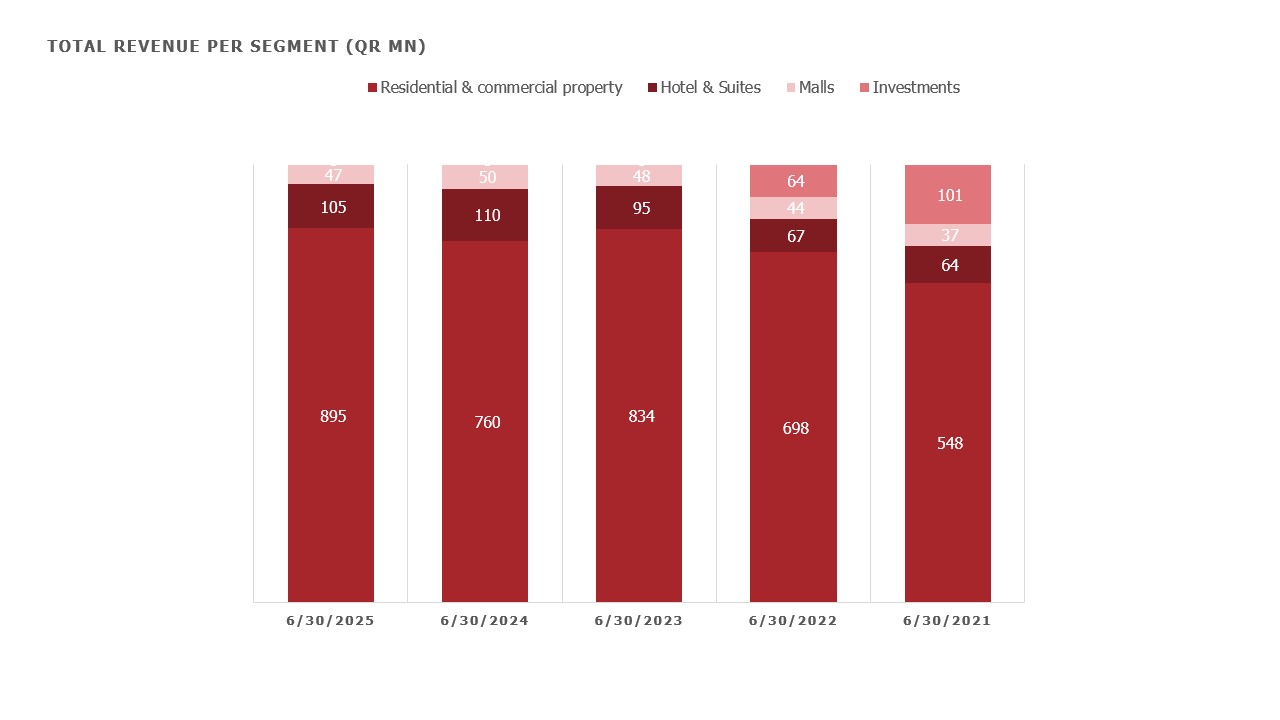
| Total Revenue |
|
|
|
|
| Residential & commercial property |
895 |
760 |
834 |
698 |
548 |
| Hotel & Suites |
105 |
110 |
95 |
67 |
64 |
| Malls |
47 |
50 |
48 |
44 |
37 |
| Investments |
- |
- |
- |
64 |
101 |
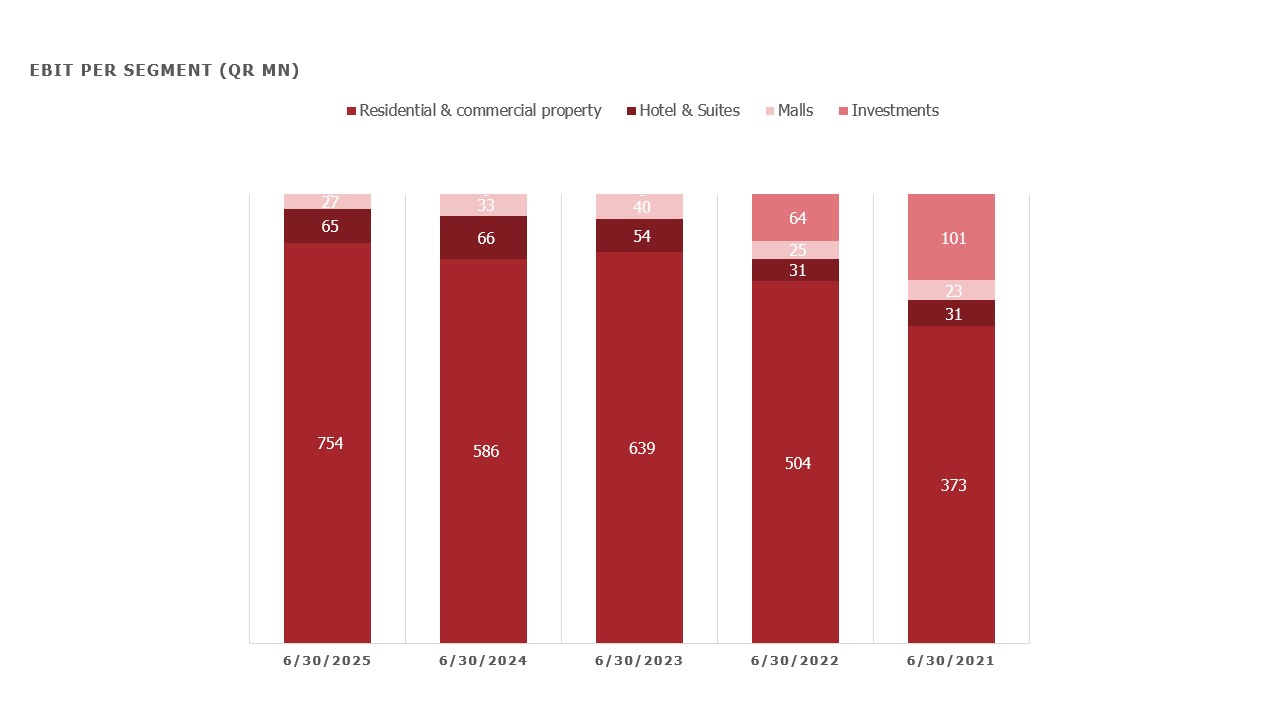
| EBIT (QR Mn) |
|
|
|
|
| Residential & commercial property |
754 |
586 |
639 |
504 |
373 |
| Hotel & Suites |
65 |
66 |
54 |
31 |
31 |
| Malls |
27 |
33 |
40 |
25 |
23 |
| Investments |
- |
- |
- |
64 |
101 |
| Segment Revenue Contribution (%)
|
|
|
|
|
| Residential & commercial property |
85.53% |
82.58% |
85.34% |
80.06% |
72.98% |
| Hotel & Suites |
9.99% |
11.95% |
9.74% |
7.64% |
8.55% |
| Malls |
4.48% |
5.47% |
4.92% |
5.00% |
4.98% |
| Investments |
0.00% |
0.00% |
0.00% |
7.30% |
13.49% |
| Segment EBIT Contribution |
|
|
|
|
| Residential & commercial property |
89.18% |
85.61% |
87.19% |
80.65% |
70.57% |
| Hotel & Suites |
7.66% |
9.64% |
7.41% |
4.99% |
5.88% |
| Malls |
3.15% |
4.76% |
5.40% |
4.07% |
4.40% |
| Investments |
0.00% |
0.00% |
0.00% |
10.29% |
19.15% |
| |
|
|
|
|
| Total Revenue |
|
|
|
|
| Residential & commercial property |
1299 |
1145 |
1229 |
1088 |
835 |
| Hotel & Suites |
155 |
155 |
143 |
105 |
101 |
| Malls |
76 |
68 |
70 |
66 |
59 |
| Investments |
- |
- |
- |
645 |
116 |
| EBIT (QR Mn) |
|
|
|
|
| Residential & commercial property |
1060 |
887 |
933 |
148 |
576 |
| Hotel & Suites |
94 |
94 |
83 |
48 |
51 |
| Malls |
47 |
45 |
49 |
40 |
34 |
| Investments |
- |
- |
- |
646 |
116 |
| Segment Revenue Contribution (%)
|
|
|
|
|
| Residential & commercial property |
84.92% |
83.72% |
85.24% |
57.12% |
75.18% |
| Hotel & Suites |
10.11% |
11.32% |
9.92% |
5.52% |
9.12% |
| Malls |
4.97% |
4.96% |
4.84% |
3.49% |
5.29% |
| Investments |
0.00% |
0.00% |
0.00% |
33.87% |
10.41% |
| Segment EBIT Contribution |
|
|
|
|
| Residential & commercial property |
88.24% |
86.52% |
87.60% |
16.84% |
74.21% |
| Hotel & Suites |
7.66% |
9.64% |
7.41% |
4.99% |
5.88% |
| Malls |
3.94% |
4.35% |
4.65% |
4.53% |
4.40% |
| Investments |
0.00% |
0.00% |
0.00% |
73.22% |
14.88% |